Scales
17 Jan 201824 minutes to read
Scales are the basic functional block of the Linear Gauge. You can improve the appearance of scales by customizing it. The functional blocks of Linear Gauge are
-
Marker Pointers
-
Bar Pointer
-
Labels
-
Custom Labels
-
Indicators
-
Ticks
-
Ranges
Adding scale collection
Scale is the basic element of Linear Gauge. Scale collection is directly added to the gauge object. Refer the following code example to add scale collection in Gauge control.
<div id="LinearGauge1"></div>$(function () {
// For Linear Gauge rendering
$("#LinearGauge1").ejLinearGauge({
enableAnimation: false,
frame: { backgroundImageUrl: "../images/gauge/Gauge_linear_light.png" },
// For Adding Scale collection
scales: [{
width: 8,
position: { x: 20, y: 50 },
backgroundColor: "Grey",
border: { color: "Grey", width: 1 },
showMarkerPointers: true, showBarPointers: false,
// For Adding label collection
labels: [{ distanceFromScale: { x: 50, y: 0 } }],
// For Adding marker pointer collection
markerPointers: [{
type: "pentagon", placement: "near",
length: 10, width: 20, distanceFromScale: 20, backgroundColor: "#FE8282"
}],
// For Adding tick collection
ticks: [{
type: "majorinterval", width: 2,
color: "#8c8c8c", distanceFromScale: { x: 30, y: 0 }
},
{
type: "minorinterval", width: 1, height: 6,
color: "#8c8c8c", distanceFromScale: { x: 30, y: 0 }
}]
}]
});
});Execute the above code to render the following output.
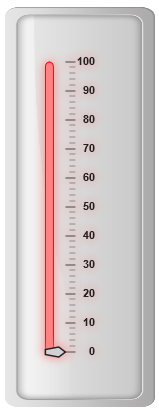
Scale Customization
Colors and Border
-
The Scale
borderis modified with border object. It has two border property,colorandwidthare used to customize the border color of the scale and border width of the scale. Setting the background color improves the look and feel of the Linear Gauge. You can customize the background color of the scale usingbackgroundColor. -
Scalesare used to enable or disable various properties such asshowRanges,showIndicators,showCustomLabels,showLabels,showTicks,showBarPointersandshowMarkerPointers,shadowOffset. Enable/disable is done by setting the property into two states either “true” or “false”. You can adjust the Opacity of the scale withopacityproperty.
<div id="LinearGauge1"></div>$(function () {
//For Linear gauge rendering
$("#LinearGauge1").ejLinearGauge({
enableAnimation: false,
frame: { backgroundImageUrl:"../images/gauge/Gauge_linear_light.png"},
//For Adding scale collection
scales: [{
width: 8,
position: { x: 20, y: 50 },
backgroundColor: "#FE8282",
border: { color: "Red", width: 1 },
//For Adding opacity
opacity: 0.5,
//For Adding Shadow offset
shadowOffset: 10,
type: "roundedrectangle",
showMarkerPointers: true,
showBarPointers: false,
//For Adding label collection
labels: [{ distanceFromScale: { x: 50, y: 0 } }],
//For Adding marker pointer collection
markerPointers: [{
type: "pentagon", placement: "near",length: 10,
width: 20, distanceFromScale: 20, backgroundColor: "#C9E1E5"
}],
//For Adding ticks collection
ticks: [{
type: "majorinterval", width: 2,
color: "#8c8c8c", distanceFromScale: { x: 30, y: 0 }
},
{
type: "minorinterval", width: 1, height: 6,
color: "#8c8c8c", distanceFromScale: { x: 30, y: 0 }
}]
}]
});
});Execute the above code to render the following output.
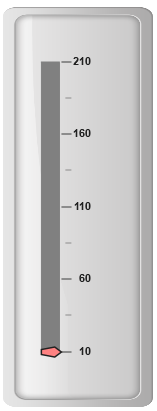
Appearance
-
You can improve the appearance of Linear Gauge using various properties. You can set the interval values for the scale with
majorIntervalValueandminorIntervalValueproperties and maximum and minimum value byminimumandmaximumproperty. Thewidthproperty is used to set the scale bar width. -
You can also adjust the Opacity of the scale with
opacityproperty. The value for opacity lies between 0 and 1.Linear Gauge contains two scale directions, clockwise and counter clockwise. It can be set withdirectionproperty.
<div id="LinearGauge1"></div>$(function () {
// For Linear Gauge rendering
$("#LinearGauge1").ejLinearGauge({
enableAnimation: false,
frame: { backgroundImageUrl: "../images/gauge/Gauge_linear_light.png" },
scales: [{
//For Adding scale width
width: 18,
//For Adding scale minimum value
minimum:10,
//For Adding scale maximum value
maximum:210,
//For Adding scale minor interval value
minorIntervalValue:25,
//For Adding scale major interval value
majorIntervalValue:50,
//For Adding scale direction
direction: "counterclockwise",
position: { x: 20, y: 50 },
backgroundColor: "Grey",
border: { color: "Grey", width: 1 },
showMarkerPointers: true, showBarPointers: false,
//Adding label collection
labels: [{ distanceFromScale: { x: 50, y: 0 } }],
//Adding marker pointer collection
markerPointers: [{
type: "pentagon", placement: "near",
length: 10, width: 20, distanceFromScale: 20,
backgroundColor: "#FE8282"
}],
//Adding tick collection
ticks: [{
type: "majorinterval", width: 2,
color: "#8c8c8c", distanceFromScale: { x: 30, y: 0 }
},
{
type: "minorinterval", width: 1, height: 6,
color: "#8c8c8c", distanceFromScale: { x: 30, y: 0 }
}]
}]
});
});Execute the above code to render the following output.
You can add the gradient effects to the scales using gradients object.
-
pointerGradient1 - It specifies the
pointerGradient1for Linear gauge. -
pointerGradient2 - It specifies the
pointerGradient2for Linear gauge.
$("#LinearGauge1").ejLinearGauge({ pointerGradient1: { colorInfo:[{ colorStop : 0, color:"#FFFFFF"},{colorStop : 1, color:"#AAAAAA"}] } });Scale Types
Scale Type is an element which decides the appearance of the gauge. Linear Gauge contains three scale type such as,
-
Rectangle
-
Rounded Rectangle
-
Thermometer
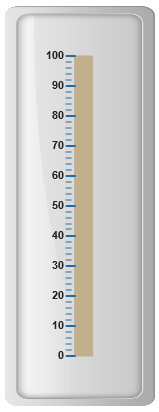
Rectangle
For rectangular scale type, the scale renders with rectangular structure. Refer the following code example.
<div id="LinearGauge1"></div>$(function () {
// For Linear Gauge rendering
$("#LinearGauge1").ejLinearGauge({
enableAnimation: false,
frame: { backgroundImageUrl: "../images/gauge/Gauge_linear_light.png" },
//For Adding Scale collection
scales: [{
width: 18, length: 300,
position: { x: 54, y: 50 },
//For Adding Scale type as rectangle
type: "rectangle",
backgroundColor: "#C0B08E",
border: { color: "#C0B08E", width: 1 },
showMarkerPointers: false, showBarPointers: false,
//For Adding tick collection
ticks: [{
type: "majorinterval", width: 2,
color: "#206BA4", distanceFromScale: { x: -27, y: 0 },
placement: "far"
},
{
type: "minorinterval", width: 1, height: 6,
color: "#206BA4", distanceFromScale: { x: -27, y: 0 },
placement: "far"
}]
}]
});
});Execute the above code to render the following output.
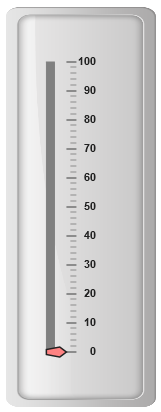
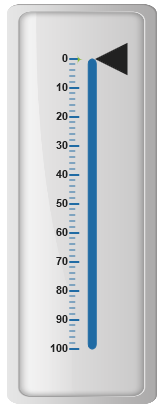
Rounded Rectangle
For rounded rectangular scale type, the scale renders as rectangular structure but with constant radius rounded corner. Refer the following code example.
<div id="LinearGauge1"></div>$(function () {
// For Linear Gauge rendering
$("#LinearGauge1").ejLinearGauge({
enableAnimation: false,
frame: { backgroundImageUrl: "../images/gauge/Gauge_linear_light.png" },
//For Adding Scales
scales: [{
width: 8,
direction: ej.datavisualization.LinearGauge.Directions.Clockwise,
position: { x: 60, y: 50 },
//Adding scale type as rounded rectangle
type: "roundedrectangle",
backgroundColor: "#206BA4",
border: { color: "#206BA4", width: 1 },
//Adding label collection
labels: [{ distanceFromScale: {x:-20,y:0}}],
//Adding tick collection
ticks: [{
type: "majorinterval", width: 2,
color: "#206BA4", distanceFromScale: { x: -27, y: 0 },
placement: "far"
},
{
type: "minorinterval", width: 1, height: 6,
color: "#206BA4", distanceFromScale: { x: -27, y: 0 },
placement: "far"
}]
}]
});
});Execute the above code to render the following output.
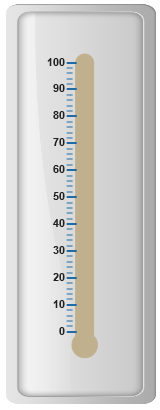
Thermometer
For thermometer scale type, the scale renders as thermometer structure with rounded bottom. Refer the following code example.
<div id="LinearGauge1"></div>$(function () {
// For Linear Gauge rendering
$("#LinearGauge1").ejLinearGauge({
enableAnimation: false,
frame: { backgroundImageUrl: "../images/gauge/Gauge_linear_light.png" },
scales: [{
width: 18, length: 300,
position: { x: 54, y: 50 },
//Adding scale type as thermometer
type: "thermometer",
backgroundColor: "#C0B08E",
border: { color: "#C0B08E", width: 1 },
showMarkerPointers: false, showBarPointers: false,
//Adding tick collection
ticks: [{
type: "majorinterval", width: 2,
color: "#206BA4", distanceFromScale: { x: -27, y: 0 },
placement: "far"
},
{
type: "minorinterval", width: 1, height: 6,
color: "#206BA4", distanceFromScale: { x: -27, y: 0 },
placement: "far"
}]
}]
});
});Execute the above code to render the following output.
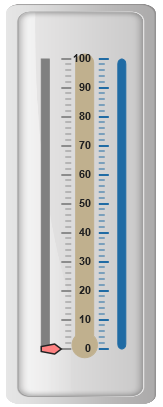
Adding multiple scales
You can set multiple scales for a single Linear Gauge control by using an array of scale objects. Each scale object is independent of each other. Refer the following code example to add multiple scale collection.
<div id="LinearGauge1"></div>$(function () {
// For Linear Gauge rendering
$("#LinearGauge1").ejLinearGauge({
enableAnimation: false,
frame: { backgroundImageUrl: "../images/gauge/Gauge_linear_light.png" },
//Adding Scale collection
scales: [
//Adding Scale 1
{
width: 8,
position: { x: 15, y: 50 },
backgroundColor: "Grey",
border: { color: "Grey", width: 1 },
showMarkerPointers: true, showBarPointers: false,
//Adding label collection
labels: [{ distanceFromScale: { x: 50, y: 0 } }],
//Adding marker pointer collection
markerPointers: [{
type: "pentagon", placement: "near",
length: 10, width: 20, distanceFromScale: 20,
backgroundColor: "#FE8282"
}],
//Adding tick collection
ticks: [{
type: "majorinterval", width: 2,
color: "#8c8c8c", distanceFromScale: { x: 30, y: 0 }
},
{
type: "minorinterval", width: 1, height: 6,
color: "#8c8c8c", distanceFromScale: { x: 30, y: 0 }
}]
},
//Adding Scale 2
{
width: 8, direction: ej.datavisualization.LinearGauge.Directions.Clockwise,
position: { x: 90, y: 50 }, type: "roundedrectangle",
backgroundColor: "#206BA4",
border: { color: "#206BA4", width: 1 },
showMarkerPointers: false, showBarPointers: false, showLabels: false,
ticks: [{
type: "majorinterval", width: 2,
color: "#206BA4", distanceFromScale: { x: -27, y: 0 }, placement: "far"
},
{
type: "minorinterval", width: 1, height: 6,
color: "#206BA4", distanceFromScale: { x: -27, y: 0 },
placement: "far"
}]
},
//Adding Scale 3
{
width: 18, length: 300,
position: { x: 54, y: 50 }, type: "thermometer",
backgroundColor: "#C0B08E",
border: { color: "#C0B08E", width: 1 },
showMarkerPointers: false, showBarPointers: false,
showLabels: false, showTicks: false,
}]
});
});Execute the above code to render the following output.