Chart Series
15 Oct 202311 minutes to read
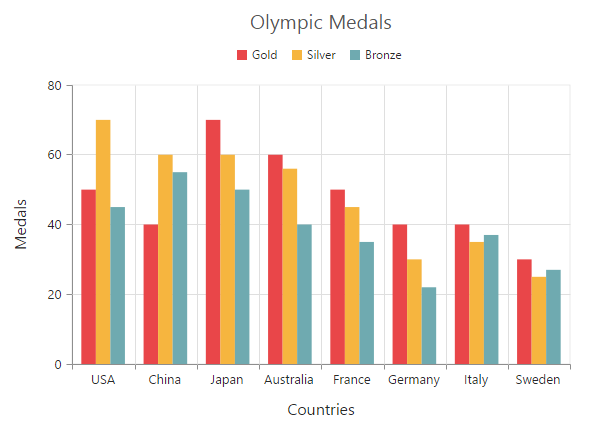
Multiple Series
In EjChart, you can add multiple series object in the series options. The series are rendered in the order it is added to the series option, by default. You can change this order by using the zOrder option.
$("#container").ejChart({
          // ...
          //Adding Multiple Series
          series: [{   // Add first series
              points: [{ x: "USA", y: 50 },
                       // ...
                  ],
                type: 'column',
                // ...
             },
            {       // Add second series
              points: [{ x: "USA", y: 70 },
                       // ...
                   ],
                 type: 'column'
                 // ...
             },
            {      // Add third series
              points: [{ x: "USA", y: 45 },
                       // ...
                  ],
                type: 'column'
                // ...
            }],

        // ...
    });
Click here to view the multiple series online demo sample.
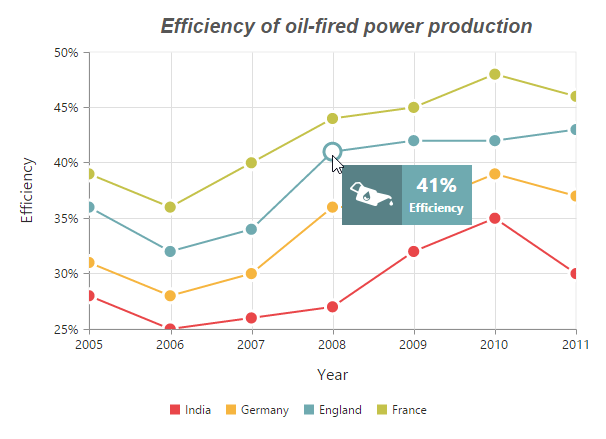
Customizing all series together
By using the commonSeriesOptions, you can customize the series options for all the series commonly, instead of setting the options directly on each series object.
NOTE
The inline properties of the series has the first priority and override the commonSeriesOptions.
The following code example explains on how to enable marker, tooltip and animation for the chart series by using the commonSeriesOptions.
$("#container").ejChart({
          //  ...

           //Initializing Common Properties for all the series
            commonSeriesOptions: {
                type: 'line',
                enableAnimation: true,
                tooltip: {
                    visible: true,
                    template: 'Tooltip'
                },
                marker: {
                    shape: 'circle',
                    size:
                    {
                        height: 10, width: 10
                    },
                    visible: true
                },
                border: { width: 2 }
            },

            series: [{
                    // ...
                },{
                    //  ...
              }],

            //  ...
      });
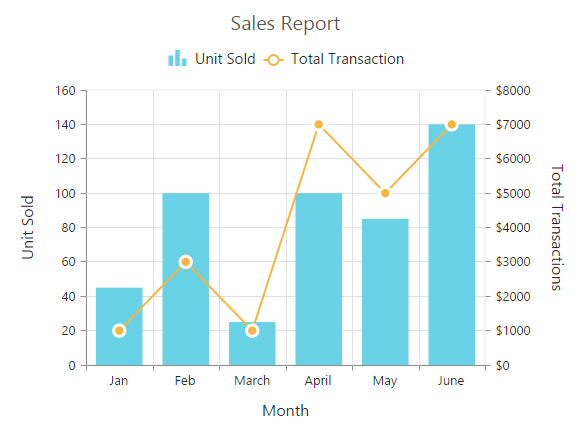
Combination Series
EjChart allows you to render the combination of different series in the chart.
$("#container").ejChart({
          //  ...

           series: [{
                //Set chart type to series1
                 type: 'column',
               // ...
            },{
                //Set chart type to series2
                 type: 'line',
               //  ...
            }],

            //  ...
      });
Click here to view the combination series online demo sample.
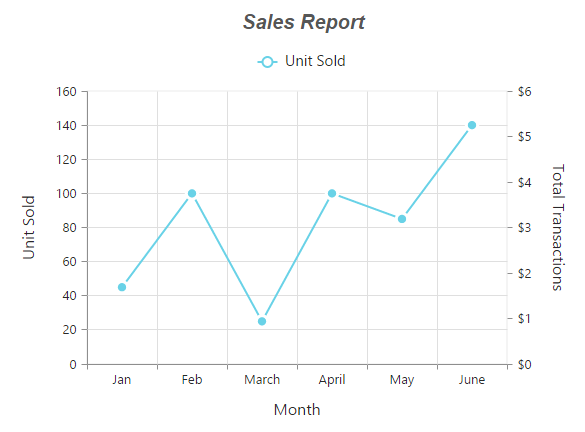
Limitation of combination chart
-
Bar,StackingBar, andStackingBar100cannot be combined with the other Cartesian type series. -
Cartesian type series cannot be combined with the accumulation series (
pie,doughnut,funnel, andpyramid). -
PolarandRadarseries cannot be combined with the accumulation and Cartesian type series.
When the combination of Cartesian and accumulation series types are added to the series option, the series that are similar to the first series are rendered and other series are ignored. The following code example illustrates this,
$("#container").ejChart({
          //  ...

          //Adding Multiple Series
          series: [{    // Add line series
                 points: [{ x: "Jan", y: 45 },
                    // ...
                 ],
                 type: 'line',
                 // ...
               },
               {       // Add [Pie](chart-types#pie-chart) series
                points: [{ x: "Jan", y: 70 },
                  // ...
                ],
              type: 'pie'
                // ...
            }],

            //  ...
      });
Init Series render
The initSeriesRender property controls whether the series has to be rendered at initial loading of chart.
This property will be useful in scenarios where chart is placed at the bottom of the web page and we need to render the series only when the chart is visible while scrolling to the top.
$("#container").ejChart({

     initSeriesRender : false

});